Australian Investment Activity
April 14th 2018 | , Urban Property Australia
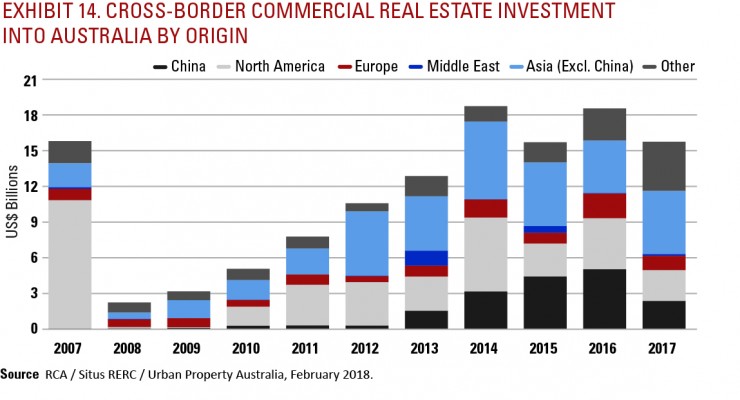
Even though Chinese cross-border investment declined 53%, the Chinese were still net buyers of Australian commercial real estate.
Australian transaction volume was ranked third in the Asia Pacific region, and seventh globally, behind the US, Germany, the UK, France, China and Japan. Of the top 14 nations in terms of transaction volume, only four experienced negative YoY growth: the US, Mexico, China and Australia. Total real estate investment (domestic and offshore) in Australia totalled $34.0 billion in 2017, 6% lower than 2016 levels, according to RCA; however, the volume is still 26% above the 10-year annual average.
The low transaction volumes were not a symptom of diminished investor interest because competition for real estate assets remains evident; however, high prices curtailed the activity. A lack of investable stock in key locations combined with property yields at historic lows crimped activity. Domestic real estate investment trusts (REITs), led by Charter Hall, DEXUS and GPT, became net buyers again in 2017.
While overseas investors accounted for approximately 51% of transactions by value in 2016, surpassing domestic investors for the first time, cross-border flow real estate investment into Australia still accounted for 46% in 2017. Cross-border real estate investment into Australia in 2017 totalled $15.8 billion, down 15% from the $18.6 billion transacted in 2016. While cross-border investment in the Australian commercial real estate market fell over 2017, total volume transacted was still the fourth highest recorded in 10 years.


After six consecutive years of cross-border investment into Australia surpassing $10 billion annually, it appears that some offshore investors have started to recycle capital placed in Australian assets, realising strong capital growth. US, Canadian and Malaysian groups were all net sellers in the Australian commercial real estate market. However, US and China capital flows into Australia both decreased by approximately half, from 2016 to 2017. Even though Chinese cross-border investment declined 53%, the Chinese were still net buyers of Australian commercial real estate.
Offshore investors spent US$1.6 billion on Brisbane-based commercial real estate assets – the highest level for the city on record, as investors made counter cyclical office acquisitions in the city.
Impacted by the Chinese government’s updated guidelines on outbound investment, Chinese investors accounted for 14% of total cross-border investment into the Australian commercial real estate market, its lowest share since 2013. In contrast, the proportion of Asian-based investment in Australia (excluding China) increased to 33%, or $5.3 billion. Singapore, Malaysia, South Korea and Hong Kong all increased their investment into Australia in 2017 compared to 2016.
Of the total capital flows into Australia, Singapore, China and the United States led the pack for single countries, with each investing over $2 billion. Although cross-border investment into the Australian commercial real estate market from US investors fell in 2017, US-based capital still was the third largest source of total cross-border investment into Australia.
Canada’s investment into Australia increased from just $26 million in 2016 to nearly $428 million in 2017, easily making it number one in YoY change. This increase in investment was highlighted by Manulife Financial Corp.’s purchase of the office building at 800 Collins St in Melbourne for $295.2 million.


Australian cities dropped in the rankings for commercial real estate investment as record prices left buyers and sellers at an impasse. For transaction volume, not including development sites, Sydney suffered a 21% decline, while Melbourne recovered slightly in the second half of 2017 to record a 12% decline. Only Brisbane showed positive annual change in transactional activity (23%). While commercial real estate investment declined over the year in Sydney, it was the 6th highest destination for commercial real estate investment in the Asia Pacific region.
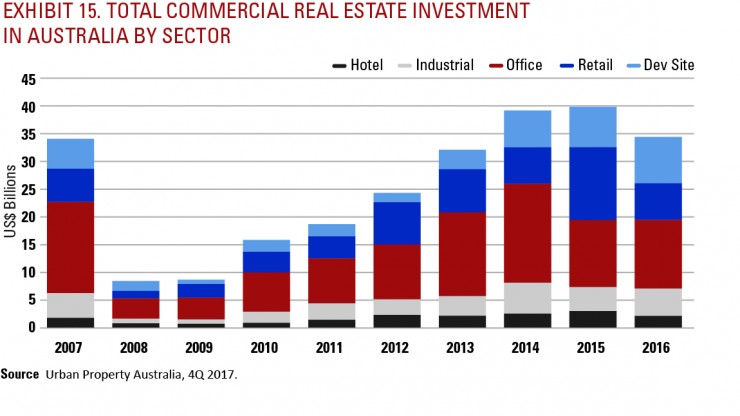
More broadly, offshore investors spent $6.9 billion on Australian office assets (see Exhibit 15), primarily in Sydney and Melbourne, capitalising on the strong rental growth recorded in the CBDs over the past two years. Offshore investors spent $1.6 billion on Brisbane-based assets — the highest level for the city on record, as investors made countercyclical office acquisitions in the city.
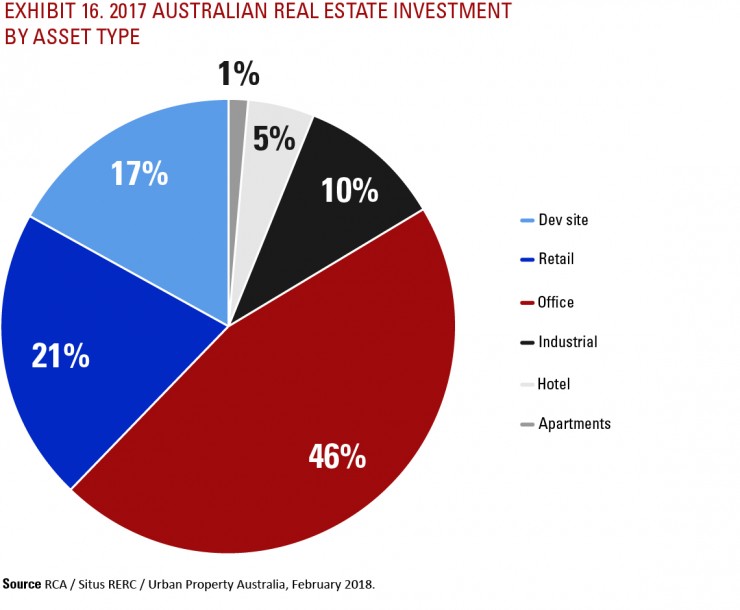
As shown in Exhibit 16, boosted by a number of major shopping centres, retail assets accounted for 21% all cross-border purchases followed by development sites (17%) and hotel properties (10%). Cross-border investment into all other Australian property sectors, however, fell in 2017 compared to the preceding year.
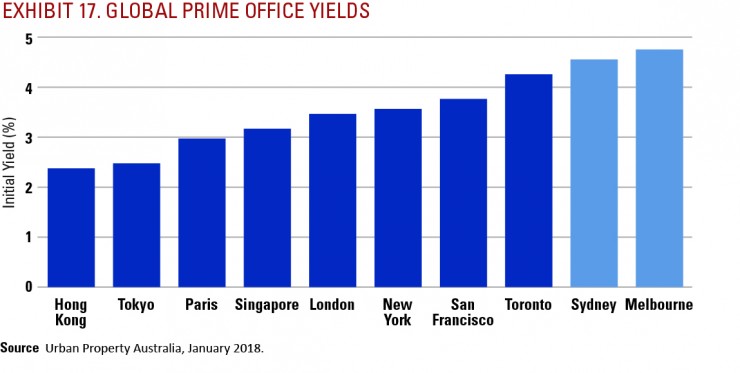
Globally, investors faced a fully priced office environment in 2017, with yields either hovering at their historic lows or compressing further throughout the year. Although the Australian office market still offers value compared to other global cities, the spread is narrowing.
Reflecting the strong rental growth achieved in Sydney and Melbourne, both cities recorded some of the greatest compression of yields globally, as shown in Exhibit 17. Over 2017, CBD office yields for Sydney and Melbourne assets compressed by 140 basis points, compared to Hong Kong offices, which compressed by 50 basis points and New York (70 basis-point compression).
Special Recognition
The sponsoring firms (Situs RERC & Urban Property Australia) would like to express their deep gratitude for Real Capital Analytics (RCA) for providing transaction volume and capital flow data during the completion of this report. All investment activity data comes from data provided by RCA. For more information about RCA’s data services, visit www.rcanalytics.com.


