Perth Economy & Property Market – December 2018
December 12th 2018 | , Urban Property Australia
- Despite the improved commodity prices, the outlook for the WA economy remains subdued.
- Perth CBD office transactional activity is on track to surpass $1 billion for only the third time.
- Industrial tenant demand, boosted by the resource investment spending.
Economy
The Western Australian (WA) economy continues to be hesitant having contracted in the year to September 2018, declining by 0.6%, although over the quarter, economic growth was positive. While the rising global demand and increased exports has increased the State’s economic growth, the domestic economy remains subdued as the current benefits from increased exports mostly show up in higher profits rather than in jobs and higher wages.
Although business confidence has fallen in recent months, reflecting the increase in uncertainty due to the imposition of tariffs by the US and China, the number of job vacancies in WA has risen over 2018 suggesting that employers are feeling more positive about the future.
While housing construction has been muted since activity peaked back in 2014, leading indicators suggest that the end of the downturn may be near. Housing prices have now stabilised having fallen since 2016 with population growth continuing to gain momentum. Despite the improved commodity prices, the outlook for the WA economy remains subdued for the short term.

Office Market
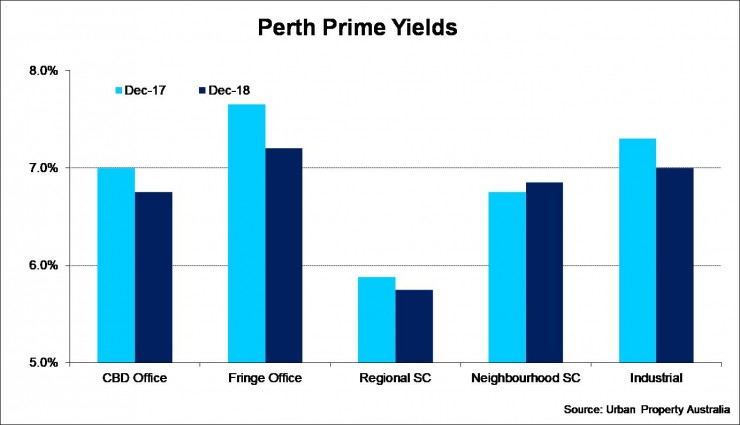
Boosted by the strong investor appetite for counter-cyclical assets, Perth CBD office transactional activity in 2018 is on track to surpass $1 billion in a calendar year for only the third time. Despite Perth CBD office yields compressing through 2018, Perth’s prime CBD office assets continue to trade at a premium when compared to comparable assets in Sydney and Melbourne.
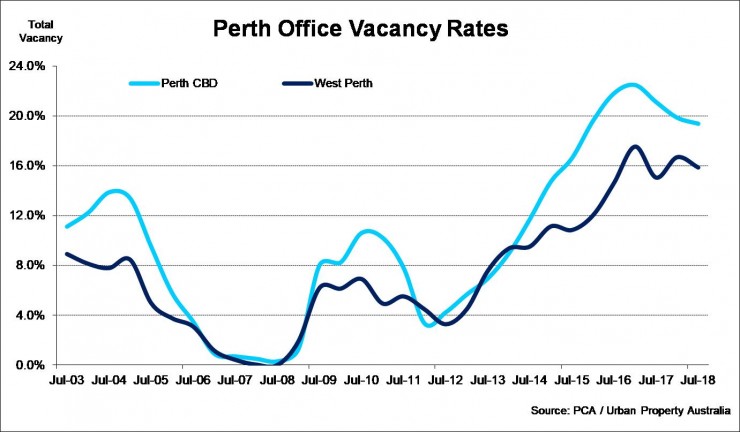
Perth premium and A-grade office yields have fallen by 25 basis points over to 2018 to 5.9% and 6.5% respectively. Echoing the improvement in economic conditions, tenant activity continues to recover, illustrated with the CBD vacancy rate falling to three-year lows.
Occupier expansion has been underpinned by the recent growth in commodity prices which has led to several new mining projects being announced. Tenants continue to capitalise on competitive leasing proposals demonstrated with the decrease of the prime vacancy rate in the Perth CBD office market which has fallen to 13.2% whereas secondary vacancy has increased for the six consecutive years to its current level of 28.9% as tenants upgrade their accommodation.
The absorption of space in prime grade assets has resulted in prime office rents growing over 2018 (albeit marginally) while secondary office rents have contracted over the year. Impacted by the attractive leasing terms of CBD assets, conditions in the West Perth office market remain soft with vacancy high at 19.4% with only modest tenant demand recorded over 2018.

Retail Market
Although the retail environment remains challenging, there are emerging signs of improvement over 2018. Having contracted last year (-0.9%), WA retail trade grew by 0.6% in 2018. Food and spending in cafes and restaurants (which collectively account for 58% of WA retail spending) continue to gather momentum, boosted by population growth which reached its highest level in three years. In contrast, the weakest category of retail spending over 2018 was the household goods sector (4.8%) following a decline of 9.8% the previous year. The slowdown in housing construction and house sales have driven the slowdown in retail spending in the household goods category.
With house prices now stabilising, Urban Property Australia expect retail turnover in Perth to improve over the next five years. Retailer demand conditions remain mixed across the Perth retail market, and across different categories. The slow pace of retail spending growth has kept retailer confidence relatively low further impacted by a range of local and national retail closures leading to increased retail vacancies throughout the Perth retail market.
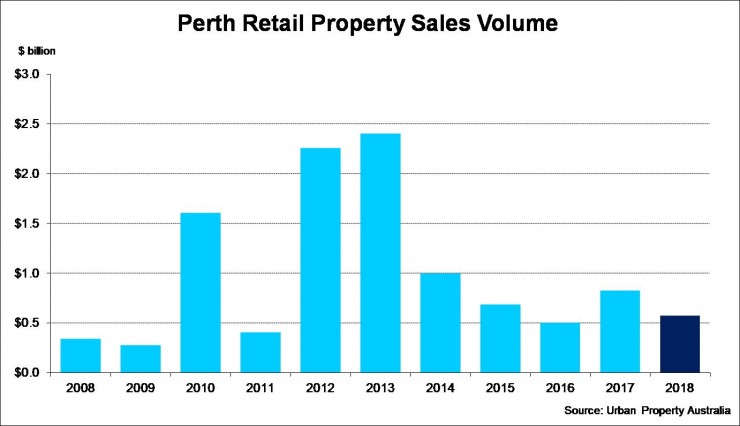
Investment activity in the Perth retail market remains subdued with $574 million of retail assets transacted in 2018, 40% below the 10-year average. There were only two retail transactions in excess of $50 million in the WA market in 2018 with investors still relatively cautious.
Reflecting the soft investor demand, Urban Property Australia only observed yield compression over the course of the year in the regional shopping centre category. In contrast, UPA has seen yields expand in all other Perth retail assets through 2018.

Industrial Market
As the WA economy continues to improve, industrial tenant demand is also showing signs of recovery. Although leasing activity across the Perth industrial market remains muted, there has been a notable increase in enquiries boosted by the resource investment spending. Reflecting the increasing leasing activity, the Perth industrial vacancy rate continues to improve, falling down to 7.8% from 8.8% a year earlier. Secondary grade buildings continue to account for the vast majority of vacancy, with 69% of the estimated vacancy coming from this class of space. As vacancy gradually declines, prime industrial Perth rents have stabilised whereas impacted by the elevated vacancy in secondary assets, secondary Perth rents continue to decline.
Transactional volume of the Perth industrial market through 2018 has fallen to its lowest total since 2011. Urban Property Australia recorded $286 million worth of industrial property that has transacted in Perth, 35% lower than the total sales volume recorded in 2017.
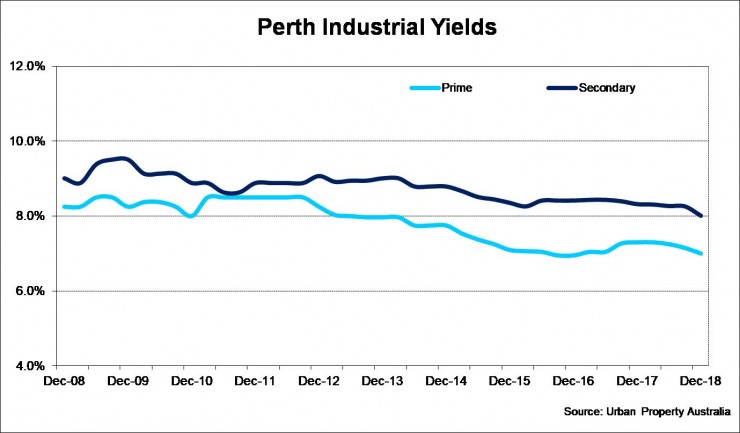
Although sales and leasing activity levels were below their 10-year averages, prime yields tightened over 2018 due to strong institutional and syndication interests, combined with limited opportunities to acquire securely leased investment grade assets. Prime yields have tightened by 40 basis points this year to now average 7.0%.

Copyright © 2018 by Urban Property Australia All rights reserved. No part of this publication may be reproduced in any form, by microfilm, xerography, electronically or otherwise, or incorporated into any information retrieval system, without the written permission of the copyright owner.


