Mid Year 2019 – Melbourne Commercial Property Market
August 5th 2019 | , Urban Property Australia
- The Victorian economy has slowed to its lowest annual growth rate in five years
- Despite a marginal rise in vacancy, the Melbourne CBD office market holds the lowest CBD vacancy rate in Australia
- Constrained by Melbourne’s shrinking land availability, new industrial supply in 2019 projected to be 25% below the 10-year average
Economy
While the Victorian economy grew by 3.0% over the year to March 2019, the second highest growth rate seen across all states and territories, it was however the lowest annual growth rate Victoria had recorded since September 2014, reflecting the moderation of economic growth witnessed across Australia. In recent years, economic growth has been supported by high rates of population growth, continued low interest rates and strong public sector investment. The growing population has been a key driver of the state economy over the past five years which has increased by almost 700,000 over that period. However, weakness in the Melbourne property market presents the largest risk for the state economy. According to CoreLogic’s hedonic index, dwelling prices in Melbourne have fallen by 8.2% in the year to July 2019, with houses seeing a fall of 10.7% and apartments 2.7%. Overall, the outlook for the Victorian economy remains positive with Victorian output forecast to increase by 2.75% in 2019/20 and 2.75% in 2020/21, but lower than the 4.4% annual average of the past three years.
Office Market
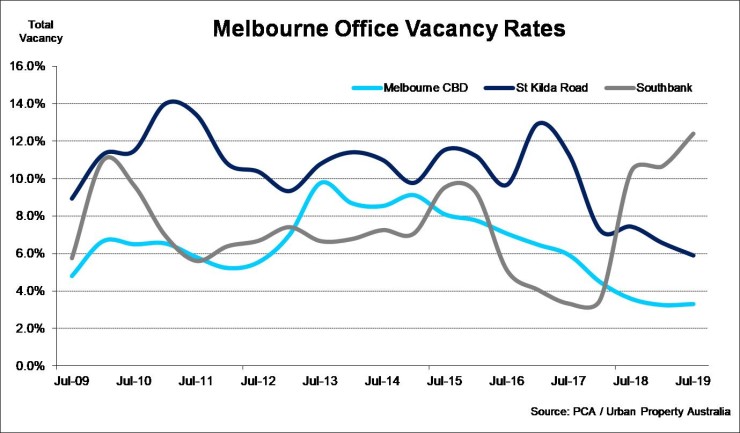
Despite a marginal rise in vacancy, the Melbourne CBD office market holds the lowest CBD vacancy rate in Australia as at July 2019 at 3.3%. Buoyed by holding the lowest vacancy rate, Melbourne also has the highest level of new supply currently under construction of all Australian office markets. While over the next three years 450,000 square metres is scheduled for completion around 90% is already pre-committed. The strong pipeline of developments under construction and in various stages of planning is likely to result in the Melbourne CBD surpassing Sydney CBD as Australia’s largest CBD office market by 2025. Although only 8,000 sqm of tenant demand was recorded in the Melbourne CBD office market over the six months to July 2019, the relatively low level of tenant demand reflects the tight vacancy environment rather than a diminishing appetite of occupiers to expand. Despite the lack of new supply delivered to the market and low vacancy, average incentives remain high at 27% with rental growth driven by an increase in face rents. Overall prime net face Melbourne CBD office rents have increased by 5% over the year to July 2019. With employment in Melbourne growing more than any other Australian capital city over the past year, Melbourne’s other office markets are largely also performing well. The vacancy rate of the St Kilda Road office vacancy has fallen to 5.9%, the lowest rate since 2001, while the City Fringe office market incorporating suburbs such as Richmond, Cremorne and South Melbourne remains below 5%. Similar to Sydney, transactional activity across Melbourne’s office markets is on track to achieve record levels with Urban Property Australia already recording $2.3 billion in 2019 to date.
Industrial Market
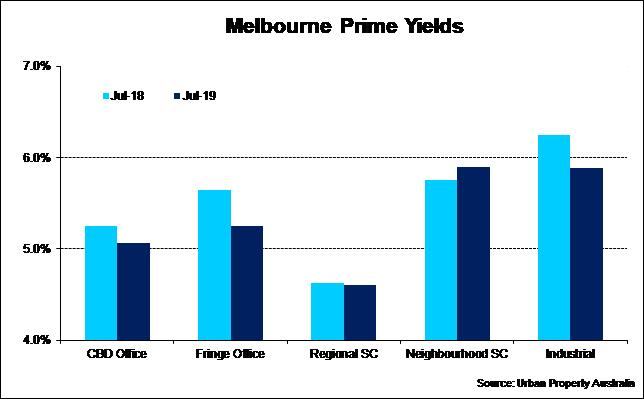
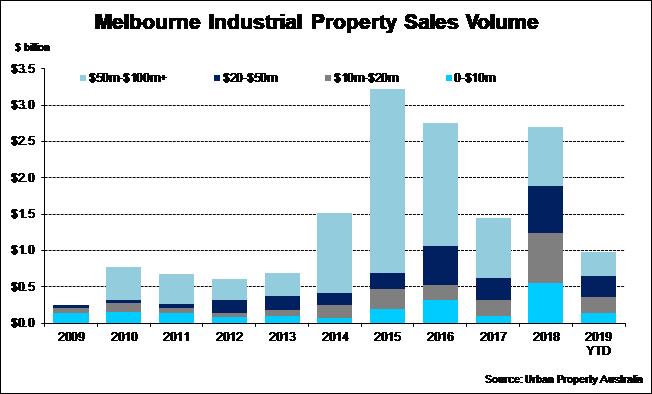
Constrained by Melbourne’s shrinking land availability, Urban Property Australia forecasts that new supply will total 450,000 square metres in 2019, lower than the 10-year average of 600,000 sqm. Limited by the constrained development pipeline, leasing activity is also below the long-term average falling from 800,000 sqm in 2017/18 to 400,000 sqm over the year to July 2019. Despite lower levels of leasing activity, the vacancy rate for the Melbourne industrial market continues to decline with Urban Property Australia estimating the vacancy at 2%, down from 3% a year prior. Reflecting the shortage of industrial land, industrial land values have increased significantly over the year to July 2019. The value of industrial lots across Melbourne smaller than 5,000sqm has increased by 30% over the past year to average $440/sqm most evident in the Western region. Buoyed by Melbourne’s strong economic and population growth coupled with the state’s infrastructure investment Urban Property Australia has recorded $975 million transacted across the Melbourne industrial market over 2019 to date. Having accounted for 45% of transactional volume for assets below $20 million in 2018, private investors and syndicate activity remains strong accounting for 37% of sales activity in 2019 to date. On the back of the continued low interest rate environment, prime yields continued to tighten, compressing by 40 basis points over the year to July 2019 to now average 5.9%.
Retail Market
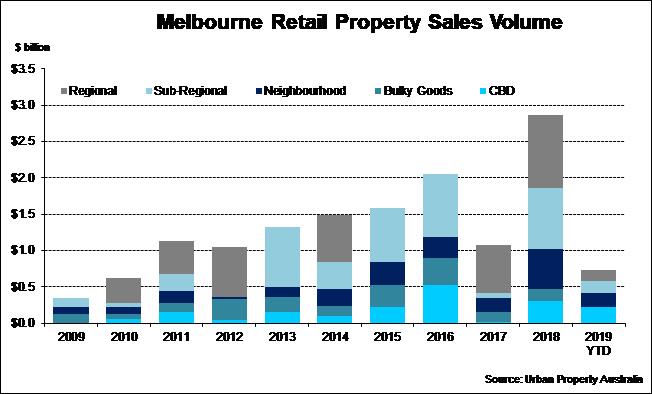
Supported by the state’s strong population growth, retail trade in Victoria has increased higher than the national average since October 2016. Over the 12 months to May 2019, Victorian retail sales grew by 4.2%, higher than 3.9% recorded a year prior and higher than the national average of 2.4%. With Melbourne’s population having grown by 590,000 over the past five years, both new and existing retailers continue to expand across the city. With the Inner city region the epicentre of city’s population growth, Melbourne continues to hold the lowest CBD retail vacancy rate of Australia’s CBDs at 4% with both Sydney and Brisbane’s CBD retail vacancy rate in excess of 8%. After retail transactional volume reached an all-time high in 2018, Urban Property Australia has recorded $780 million in 2019 to date, 16% down on levels recorded in the first half of 2018. Although domestic institutions continue to divest under performing assets that are exposed for repositioning, there have only been three retail assets sold in excess for $100 million, private investors continue to be active for properties under $10 million. Reflecting the easing investor demand for retail assets, Urban Property Australia estimate that yields have expanded for all Victorian retail property types over the year to July 2019 with the exception of Regional shopping centres.
Copyright © 2019 by Urban Property Australia All rights reserved. No part of this publication may be reproduced in any form, by microfilm, xerography, electronically or otherwise, or incorporated into any information retrieval system, without the written permission of the copyright owner.

