Mid Year 2019 – Adelaide Commercial Property Market
August 5th 2019 | , Urban Property Australia
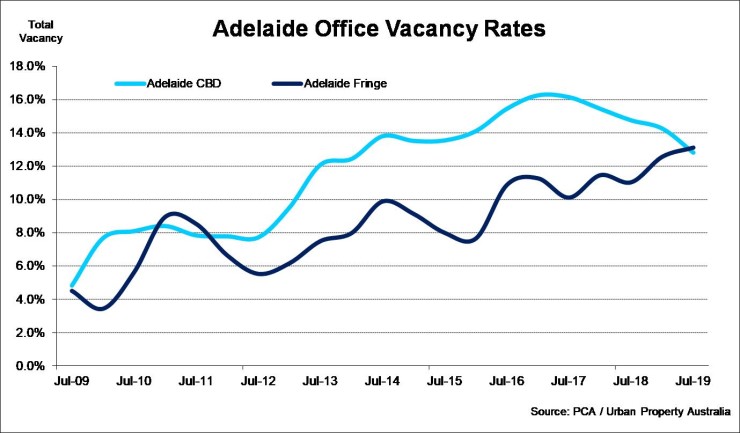
- The vacancy rate of the Adelaide CBD office market has declined to its lowest level since 2014
- Despite population growing at a three-year high and total employment reaching an all-time high, rents eased across all Adelaide’s retail categories over the year
- In line with the improving tenant confidence and increased infrastructure spend new industrial supply is projected to reach 10-year highs in 2020
Economy
The South Australian economy has performed relatively well recently, buoyed by the low Australian dollar, low interest rates and strong global growth which has supported the State’s strengths in farming, manufacturing and tourism. In addition, the South Australian 2019/20 budget provided $11.9 billion for a pipeline of projects over the next four years which will also contribute to ongoing growth. Over the year to March 2019, SA’s economy grew by 1.8%, slightly below the 2.2% growth achieved a year earlier. Private new business investment in South Australia has also been strong by historical standards rising 11% in the year to March 2019. This strength in public and private investment is anticipated to offset the effects of subdued household consumption and dwelling construction activity over the coming 12 months which is consistent with the national trend. South Australia’s economy is forecast to grow 2.5% in 2019/20 then resume trend growth of 2.25% per cent per annum from 2020/21 through to 2022/23.
Office Market
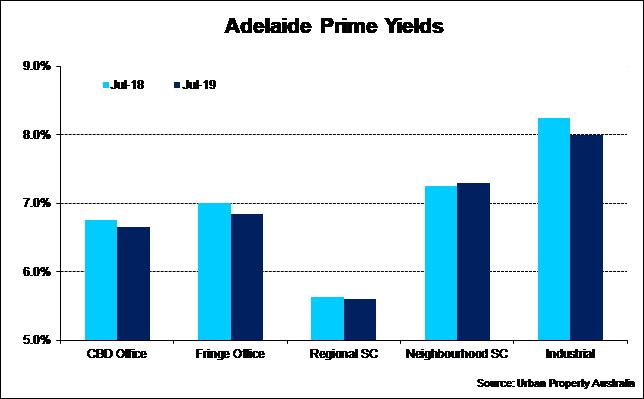
Buoyed by increasing business investment and demand from the defence industry, the vacancy rate of the Adelaide CBD office market declined for a fifth consecutive period. As at July 2019, the Adelaide CBD office market fell to 12.8%, the lowest level since January 2014. Over the first half of 2019, 15,900 sqm of office space was absorbed in the CBD, the highest level of tenant demand recorded for a half-year in 10 years. As economic growth continues to gather momentum, tenant demand for office space is expanding with the defence, professional services, health and IT sectors all expanding their presence in the CBD. The CBD office market was also boosted by tenants relocating into the market from other markets highlighted by Beach Energy’s move into 80 Flinders Street from Glenside. Looking ahead, Urban Property Australia expects further falls with limited new vacant supply currently under construction. There are only two projects currently under construction in Adelaide, of which 87% is already pre-committed. Following the renewed tenant activity and declining vacancy rate, prime rents have grown with incentive levels tightening over the year to July 2019. Having achieved the second highest level of transactional volume last year with $530 million recorded, 2019 to date has been more subdued with only $115 million of Adelaide office property transacted. Given the spread of yields for Adelaide office assets in comparison to Eastern Seaboard office assets, Urban Property Australia has seen steady yield compression for Adelaide office assets over the past two years. Over the year to July 2019, prime CBD office yields compressed by 10 basis points to average 6.7% with secondary CBD office yields steady at 7.5%.
Industrial Market
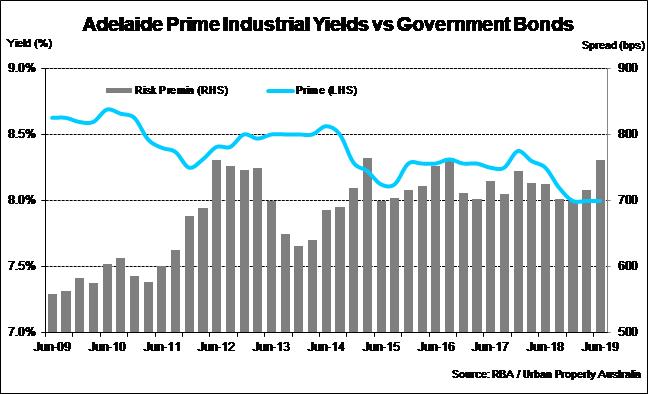
The significant investment in infrastructure in Adelaide coupled with the abolishment of stamp duty for commercial transactions (which became effective on 1 July 2018) led to substantial increase in investment activity in the Adelaide industrial market. Last year, Urban Property Australia recorded $355 million of total industrial transactions in Adelaide, the highest annual level on record. In 2019 to date, Urban Property Australia has recorded $50.3 million of industrial property transacted in SA with yields in the city still offering a premium to industrial assets in Sydney, Melbourne and Brisbane. Accordingly, the increasing investor demand resulted in further increases in prices and compression in yields for prime assets. Prime yields have tightened by 25 basis points this year to now average 8.0%, while in the secondary market, yields have remained steady at 9.0%. In line with the improving tenant confidence boosted by increased infrastructure spending and growth in defence industries, advanced manufacturing, vacancy in the Adelaide industrial market has fallen to 3.5%, down from 4.5% a year ago. Reflecting the increased business confidence, although new supply projected in 2019 will be similar to 2018 levels, Urban Property Australia forecasts that new supply will total 250,000 square metres next year, the highest annual level since 2007. With vacancy relatively low and a strong pipeline of infrastructure, investor demand is expected to remain robust underpinning further yield compression in the short term.
Retail Market
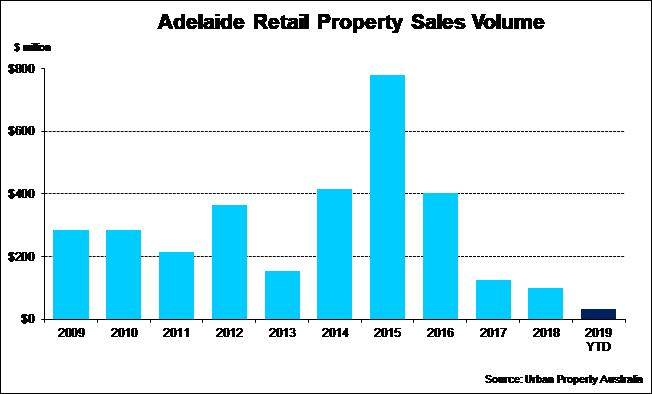
With South Australia’s population growing at a three-year high and total employment reaching an all-time high, retail trade continued to gather momentum. Over the year to May 2019, SA retail trade grew by 2.9% compared with 2.4% as at May 2018. Reflecting the relative resilience of the Adelaide housing market (in contrast to the Eastern Seaboard), household goods retail spending grew by 8.6% while Food retail sales grew by 1.8% and Other retail sales grew by 7.5%. Despite the overall growth of retail trade in South Australia, rents eased across all Adelaide’s retail categories over the year to July 2019 with sub-regional shopping centre rents having fallen by 10% and CBD retail rents 5% lower over the year. Over 2019 to date, South Australia has recorded the lowest sales volume for retail property across Australia’s major states with only $35 million transacted this year. Having peaked in 2015, the volume of retail property transactions has progressively declined with limited opportunities for major investors. In fact, Urban Property Australia has only recorded three Adelaide retail assets that have transacted above $40 million over the past three years. With limited transactional evidence, yields for Adelaide’s retail assets remained relatively steady over the year to July 2019.
